Explore the Compound Layout Lineage View
Alation Cloud Service Applies to Alation Cloud Service instances of Alation
Customer Managed Applies to customer-managed instances of Alation
Important
You are viewing documentation for Alation’s Classic User Experience.
The Compound Layout lineage view is a lineage visualization that clusters related lineage nodes by data source, allowing users to navigate complex data relationships and focus on specific areas of interest. The Compound Layout view is available on the Lineage tab of catalog pages for tables, views, BI, and file system objects.
To switch to the Compound Layout view, activate the Use Compound Layout View toggle on top of the lineage chart area.
You can explore the compound layout view using these capabilities:
Load Lineage Charts Incrementally
Lineage charts can sometimes be quite large, containing numerous nodes across multiple data sources. Large charts often include numerous temporary nodes and dataflows, reflecting complex data transformation pipelines. The density and scale of such charts can make them challenging to interpret due to the number of nodes displayed in the chart area.
When users first open a large lineage chart, a popup window is available to make a default selection to load a large lineage chart either in:
Incremental Load: Allows users to expand a large lineage chart gradually by clicking on the nodes.
Load all at once: Allows users to view an expanded lineage chart containing all the nodes at once.
Users can change the default option later through a Incremental Load dropdown button on the lineage chart.
Note
Lineage charts may fail to load fully if they exceed performance limits. The Alation server has a fixed performance limit of 500 lineage nodes per chart, which cannot be modified. When a chart surpasses this threshold, the lineage chart will automatically switch to Incremental Load, and it won’t be possible to select the option Load all at once.
Catalog Admins or Server Admins can configure the incremental load step by specifying how many nodes are displayed with each click that expands the chart. To configure incremental lineage, refer to Configure Incremental Loading.
Limitations
The incremental load is only available for the Full Lineage view and is currently not supported for the Column Trace View.
Highlight Nodes and Lineage Paths
When you initially open the Lineage tab for a catalog object, this main object is highlighted in blue. You can click any node or dataflow object on the chart: this will shift the blue highlighting to the element you click to indicate that it’s selected and currently in the focus. The lineage paths to and from the object will also become highlighted, allowing you to visually trace the data flow.
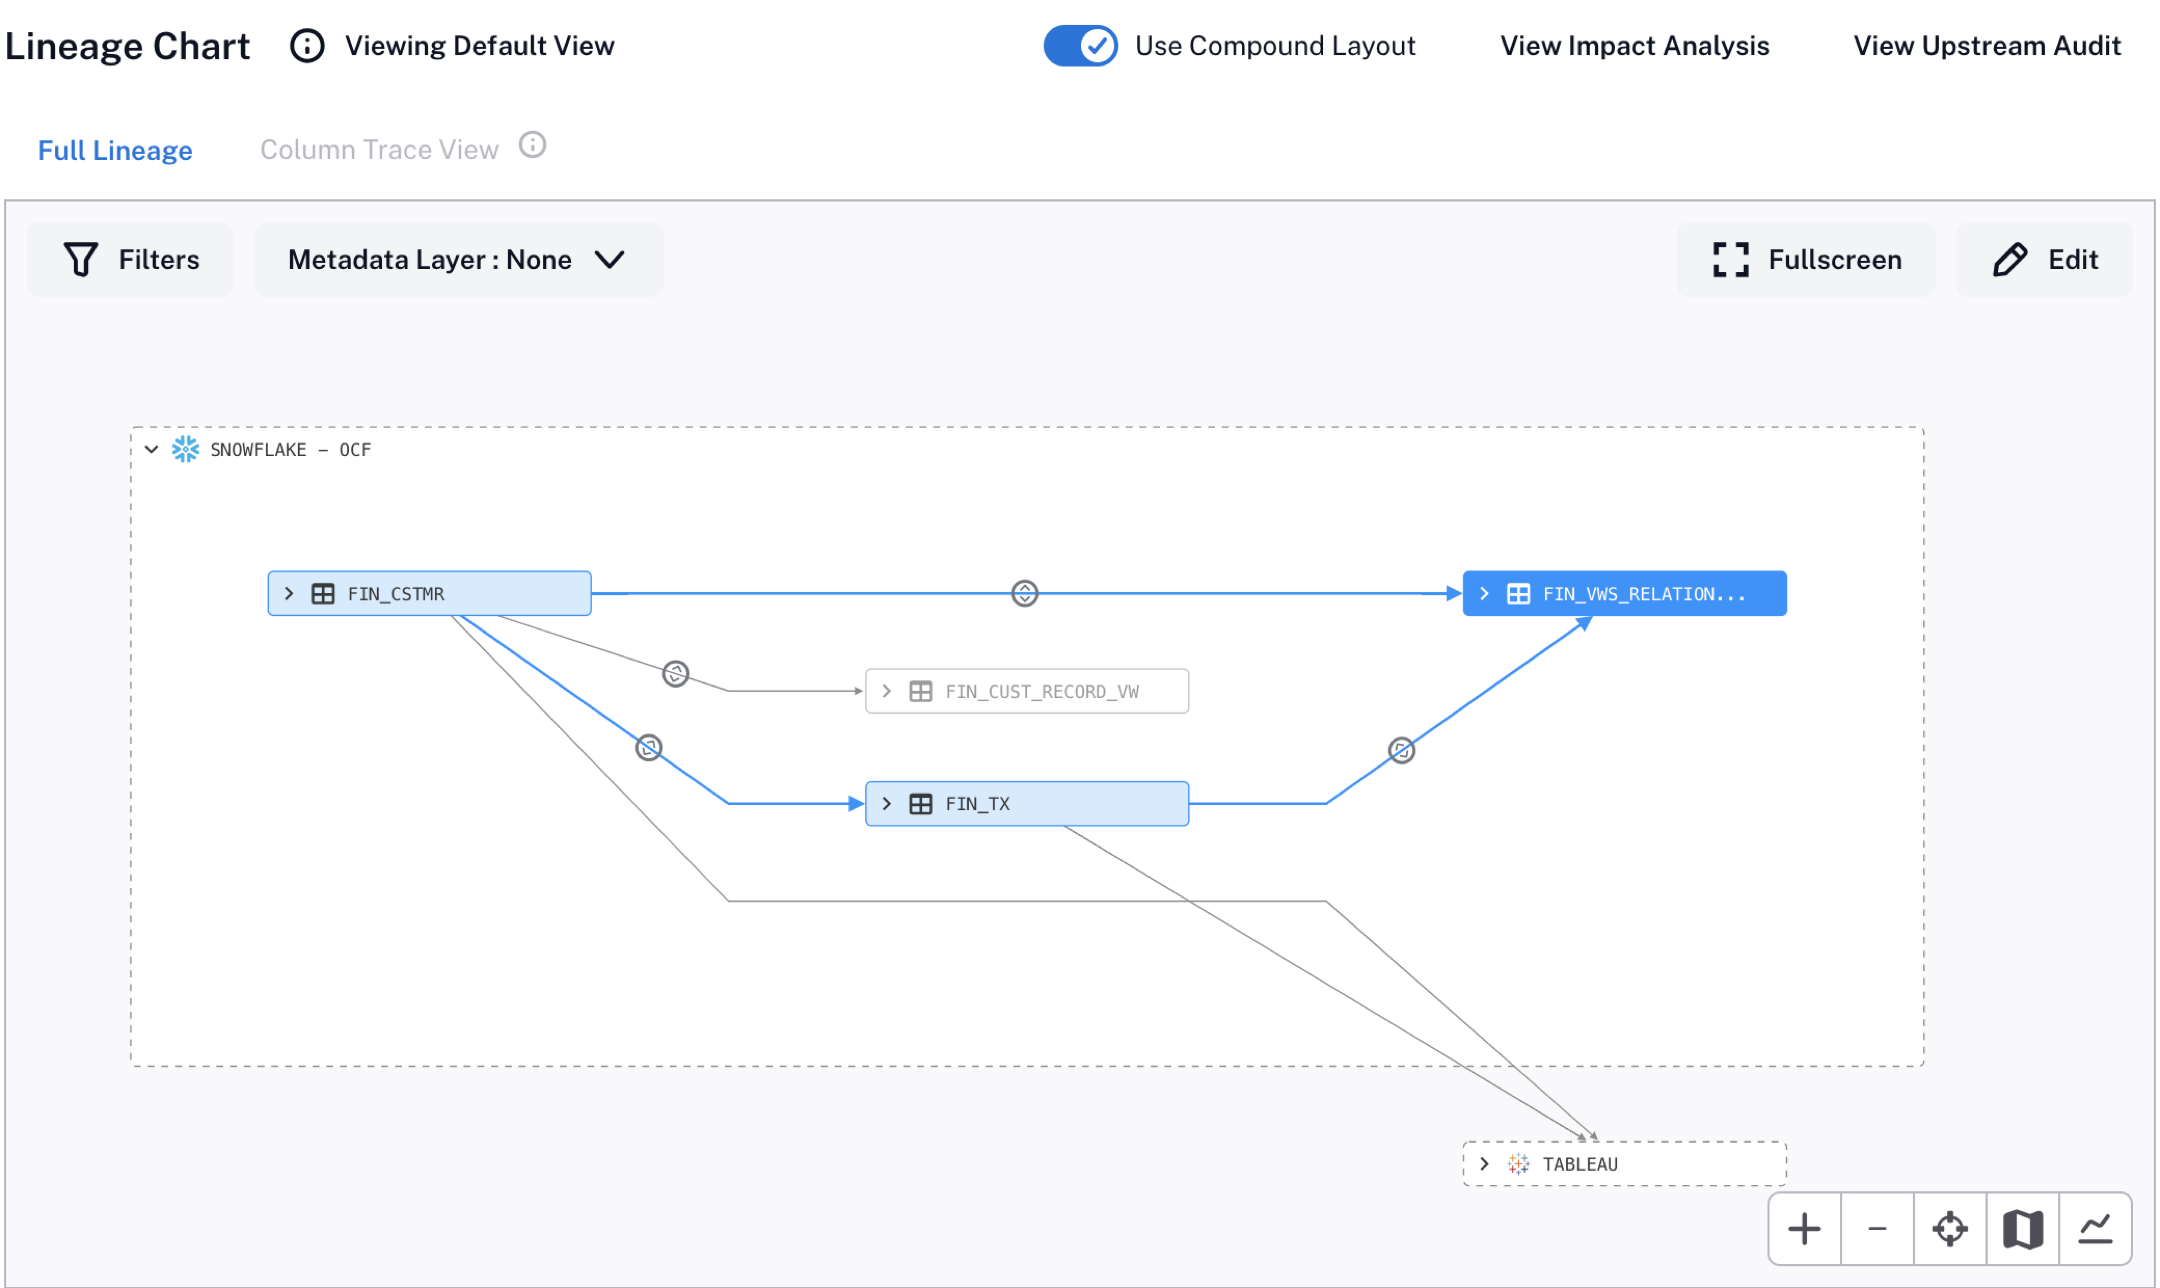
You can view information about the selected object in the object preview area under the chart.
View Node Object Details
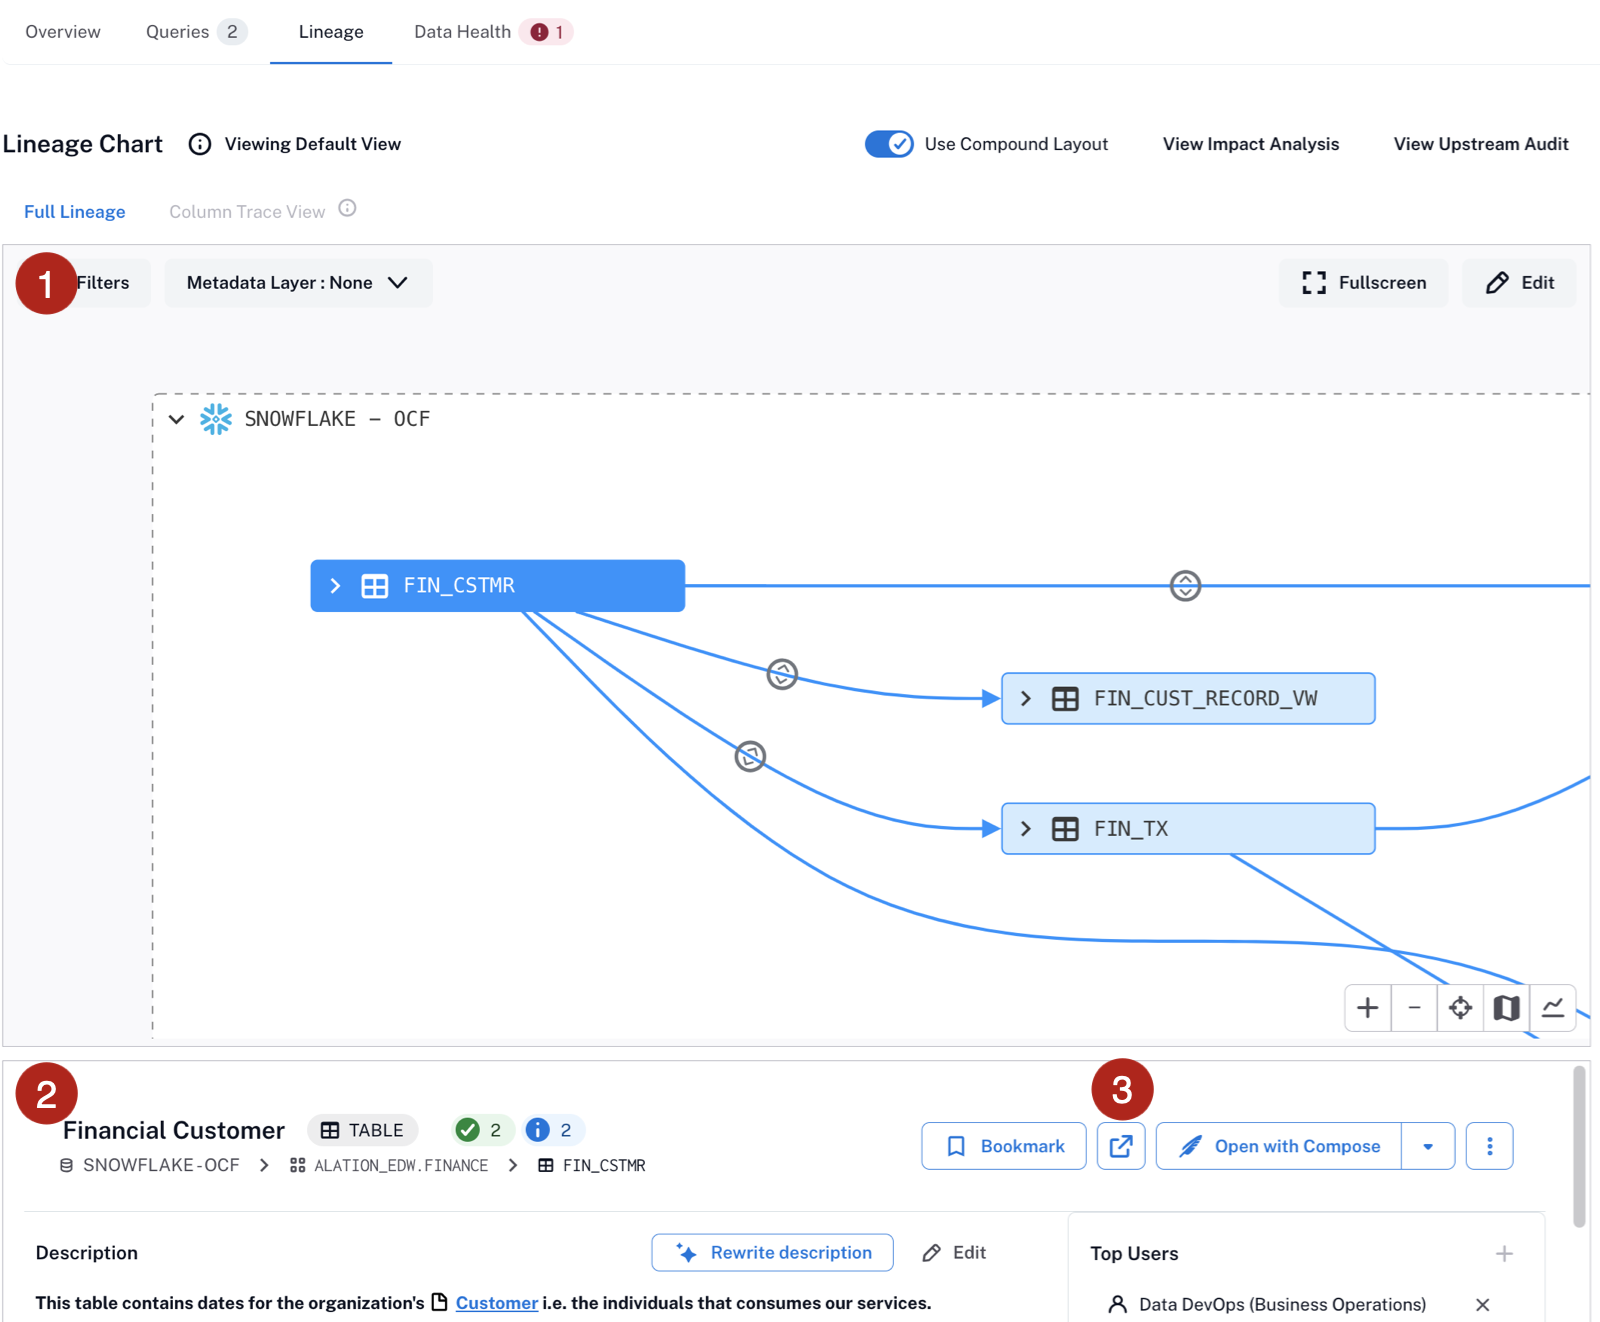
The lineage chart is divided into two sections: the chart area and the object preview pane under the chart.
Note
If an object doesn’t exist in the data catalog, the preview pane will tell you that there’s no data associated with this object. This is the case for temporary and external objects:
If the object doesn’t exist but its type is supported by Alation, the object will be marked with the TMP (temporary) badge.
If the object doesn’t exist and its type isn’t supported by Alation, then the object is marked with the EXT (external) badge.
When you select a node on the lineage chart, a preview of the corresponding catalog page loads into the preview area. To go to the catalog page of the selected node, click on the “Go to” button next to the object name.
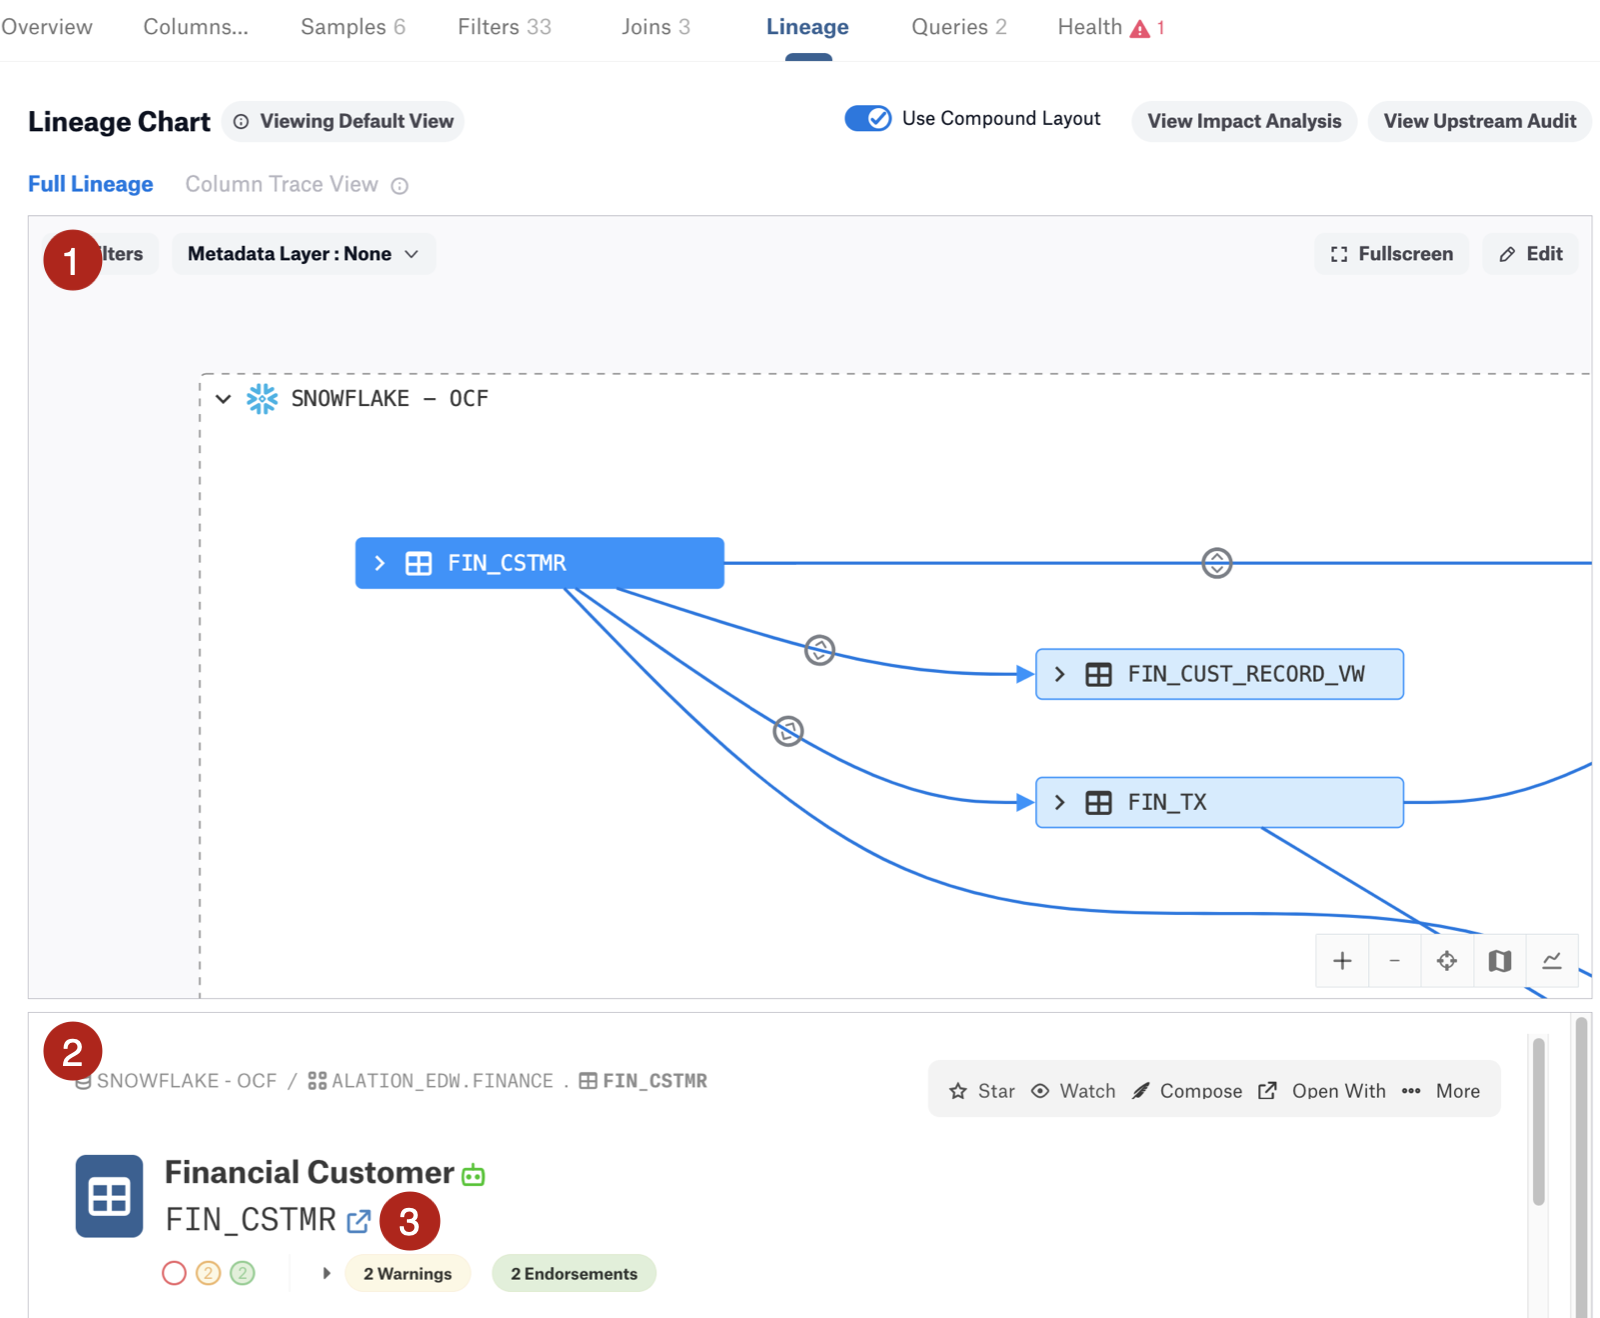
The screenshot below shows the chart and preview areas:
The chart area: 1
The object preview area: 2
Navigation to the catalog page of the selected object: 3
View Dataflow Content
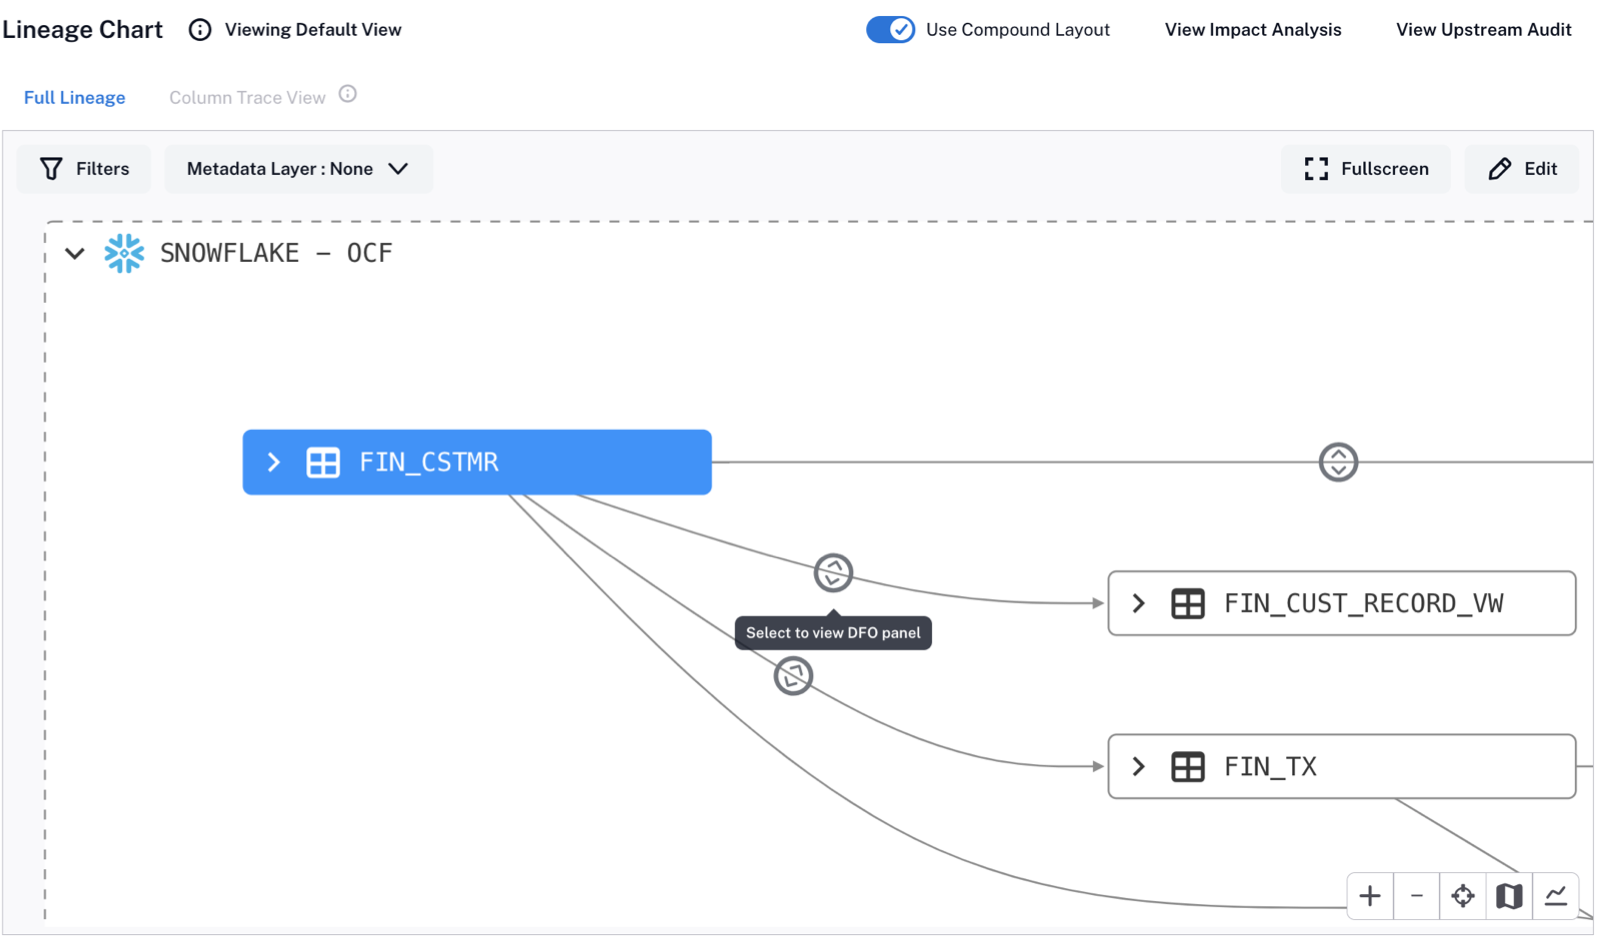
The Compound Layout View doesn’t display dataflow objects to save space. Transformations are represented by expansion icons on lineage paths. Click on an expansion icon to view the dataflow object information in the object preview area below the chart.
Move the Chart Within the Chart Area
You can focus on specific parts of the chart by dragging the chart around within the chart area.
To move the chart, place the cursor on the chart area, press and hold, and then drag the chart.
Enter Full-Screen Mode
You can view the chart in full-screen mode.
Click the Fullscreen button to open the full-screen mode of the chart.

Full-screen mode has the same features as normal mode. Additionally, you can dock the object details area on the bottom or on the right.
Dock the object preview at the bottom—4
Dock the object preview on the right side—5
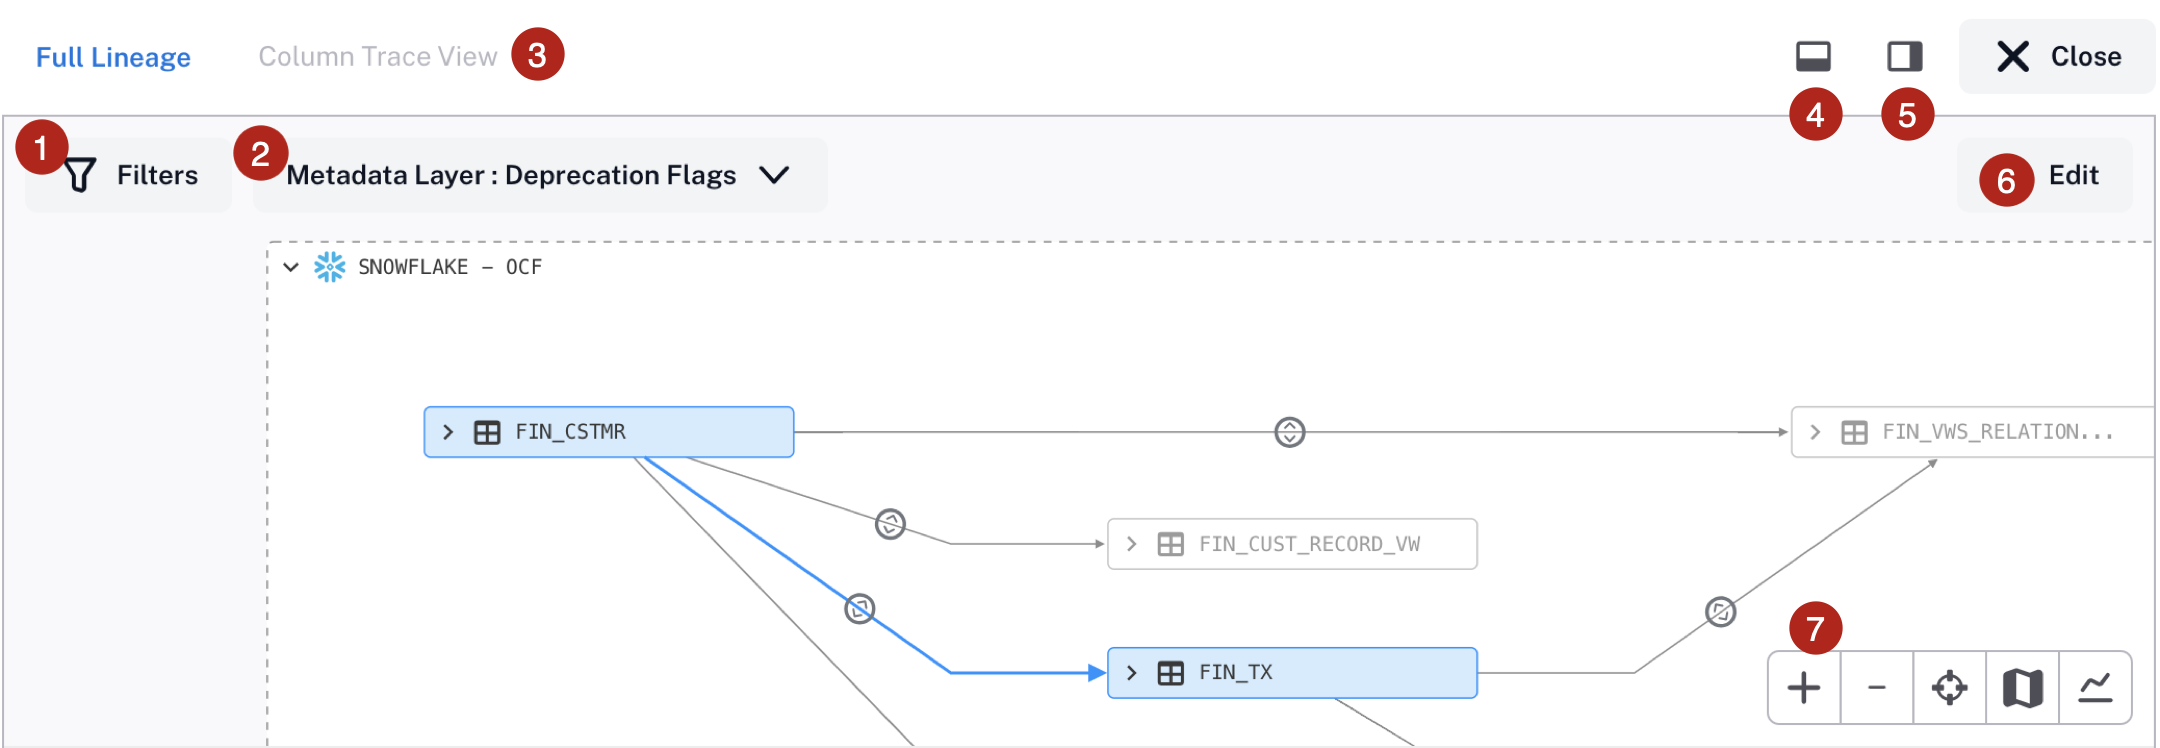
You can exit from the full-screen view any time by clicking the Close button on the top right of the fullscreen window.
Use the Chart Control Panel
You can interact with the lineage chart using a number of view controls in a panel in the bottom right corner.
Use the plus icon to zoom in—1
Use the minus icon to zoom out—2
Use the Center icon to center the main node on the chart area. The main node is the object that you’re viewing the catalog page for—3
Open the Chart Minimap—4
Open the Chart Legend—5
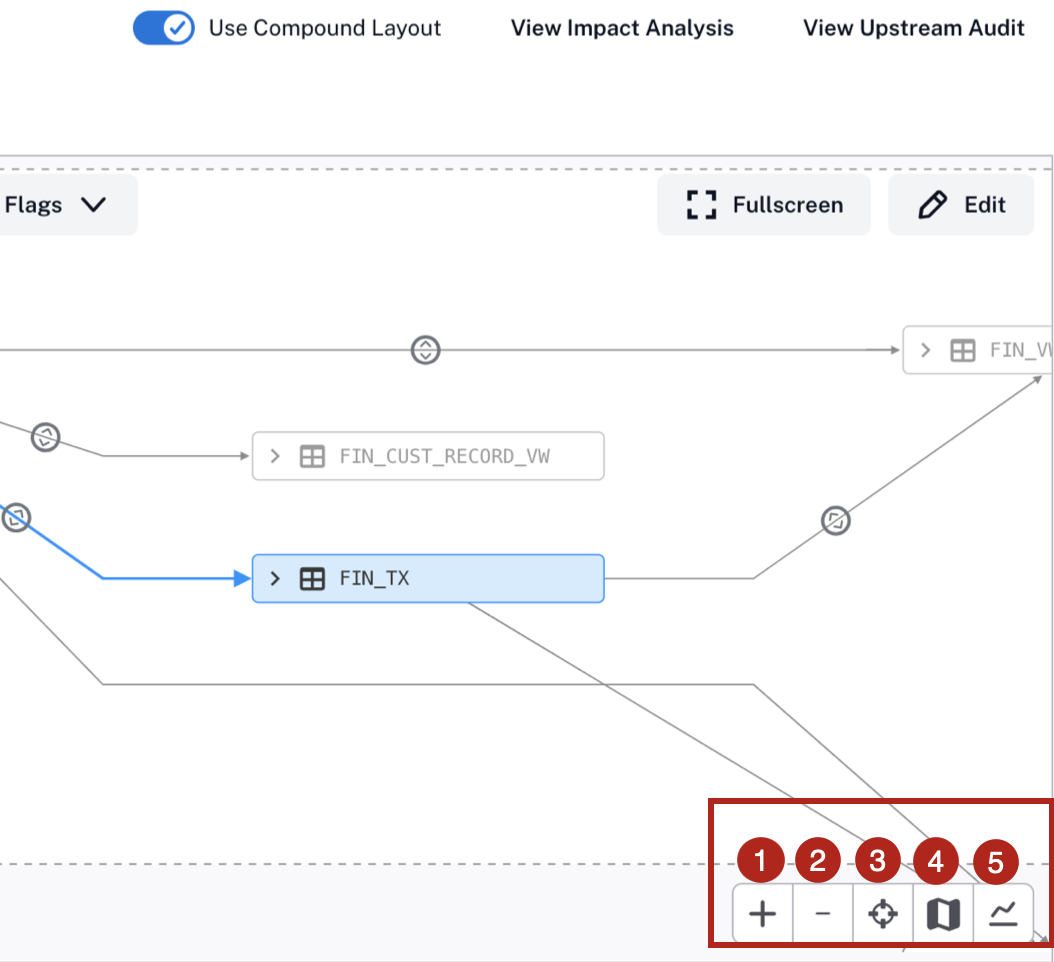
Chart Minimap
Alation Cloud Service on the cloud-native architecture
You can move around lineage charts using the minimap navigational feature:
Click the Minimap icon to open the minimap. A gray rectangular segment on the map tracks the section of the lineage chart that you are currently viewing.
Position the cursor over the gray segment, press and hold, then drag it across the map. The lineage chart will update to display the corresponding area of lineage.
To close the minimap, click the the Minimap icon again.
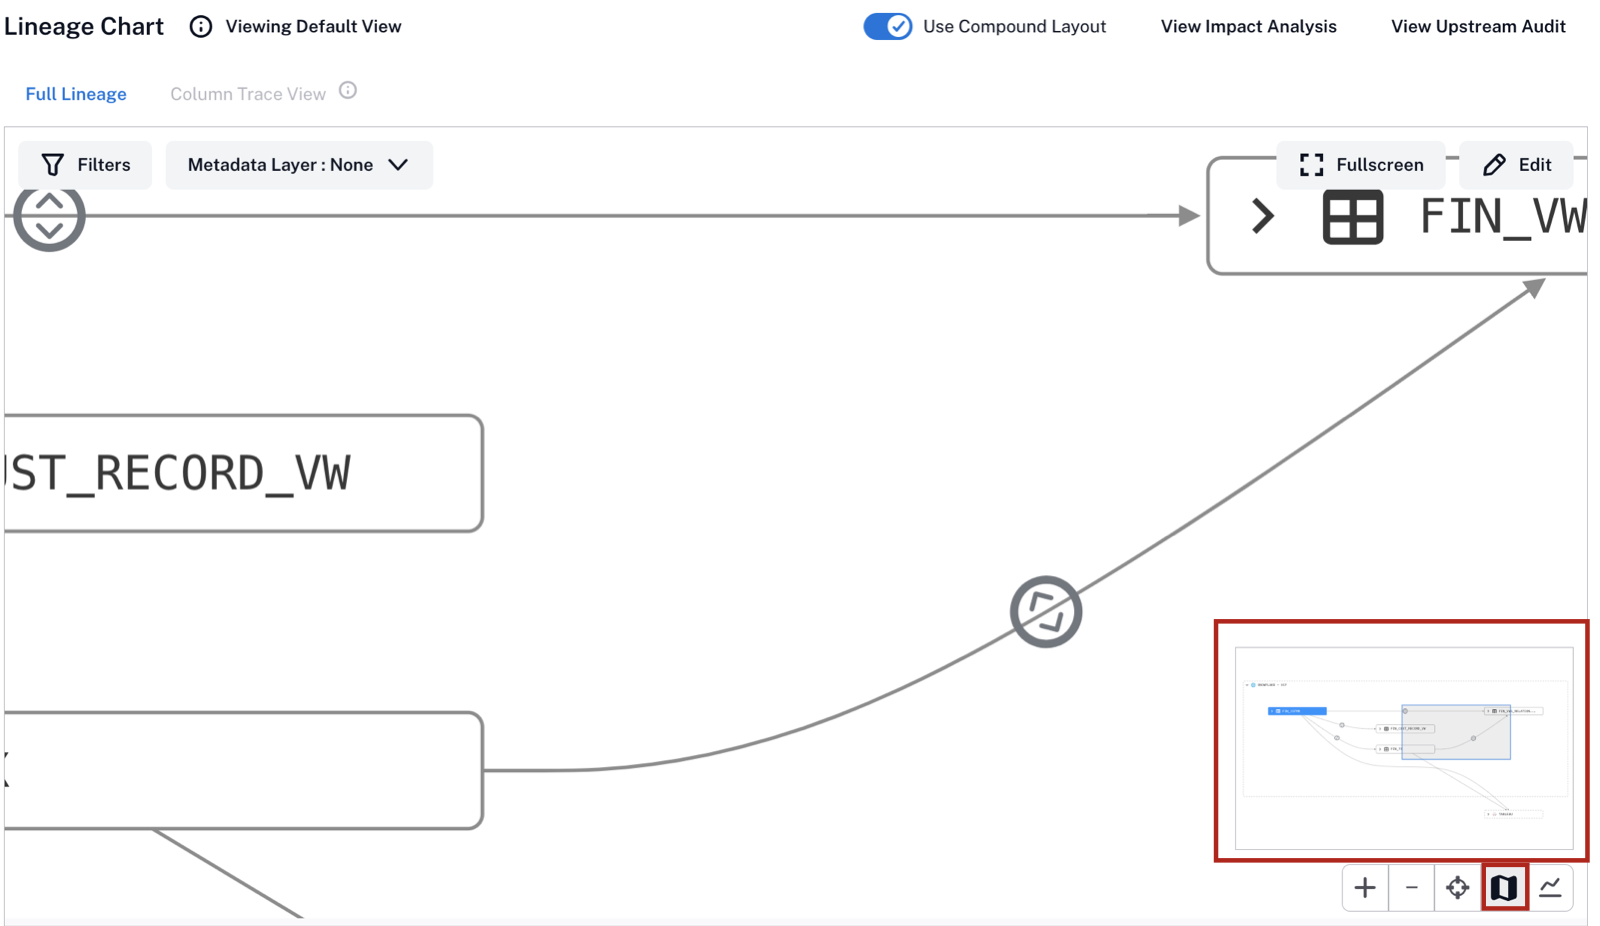
Chart Legend
Alation Cloud Service on the cloud-native architecture
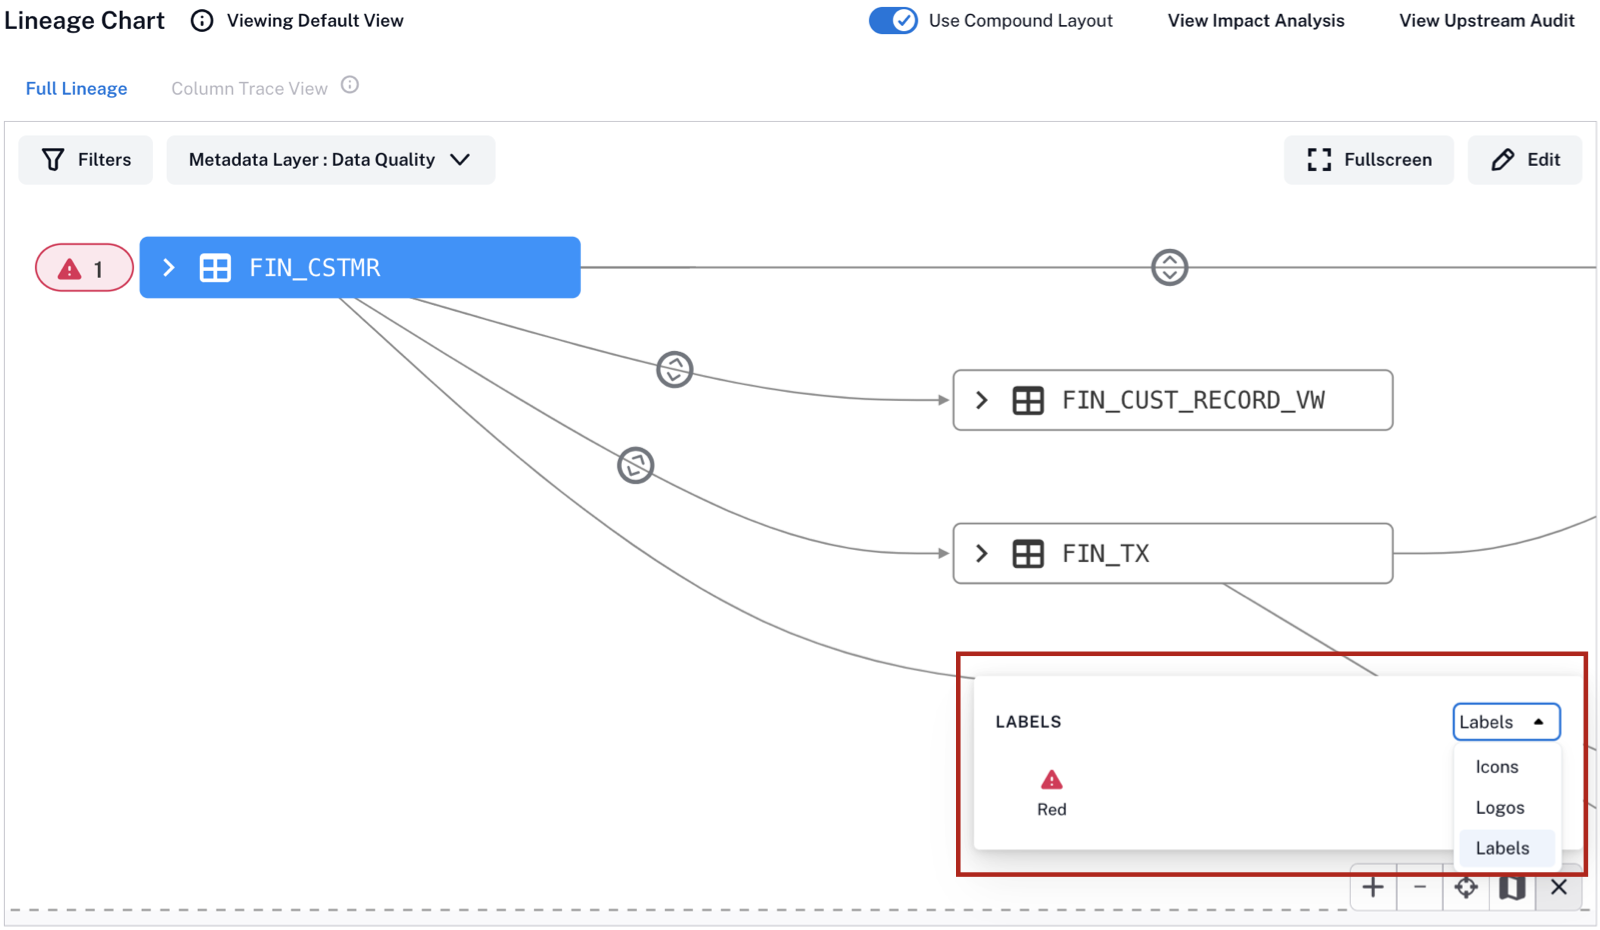
You can bring up the chart legend that explains all the icons currently displayed on the chart:
Click the Legend icon to open the legend.
To list through the icon types (icons, logos, labels), use the list on the right.
To close the legend, click the the Legend icon again.
Trace Column Lineage
By default, lineage charts show lineage at the table level, but you can also trace column-level lineage for each column:
Expand a lineage node by clicking the arrow icon. A list of the columns appears.
Hover over a column name. A Trace Lineage button appears beside the column.
Click the Trace Lineage button. As the column-level view is being loaded, a message appears on bottom right of the screen:
When the view is ready, the View Lineage button becomes available for the corresponding column. Click View Lineage to enter the Column Trace View, which shows the lineage for this column.
You can switch between the Column Trace View and the Full Lineage view by clicking their respective tabs at the top of the lineage chart.
Apply Filters
You have the ability to show or hide temporary nodes from lineage charts and to select whether to display technical names of nodes or their business titles.
Filter Out Temporary Objects
Alation creates temporary nodes when the corresponding objects are present in the lineage metadata but don’t exist in the Alation catalog, so a record in the metadata can’t be matched with a cataloged resource. On lineage charts, temporary objects are represented with nodes with the TMP badge. By default, they are hidden from Compound Layout.
You have the ability to show or hide temporary objects:
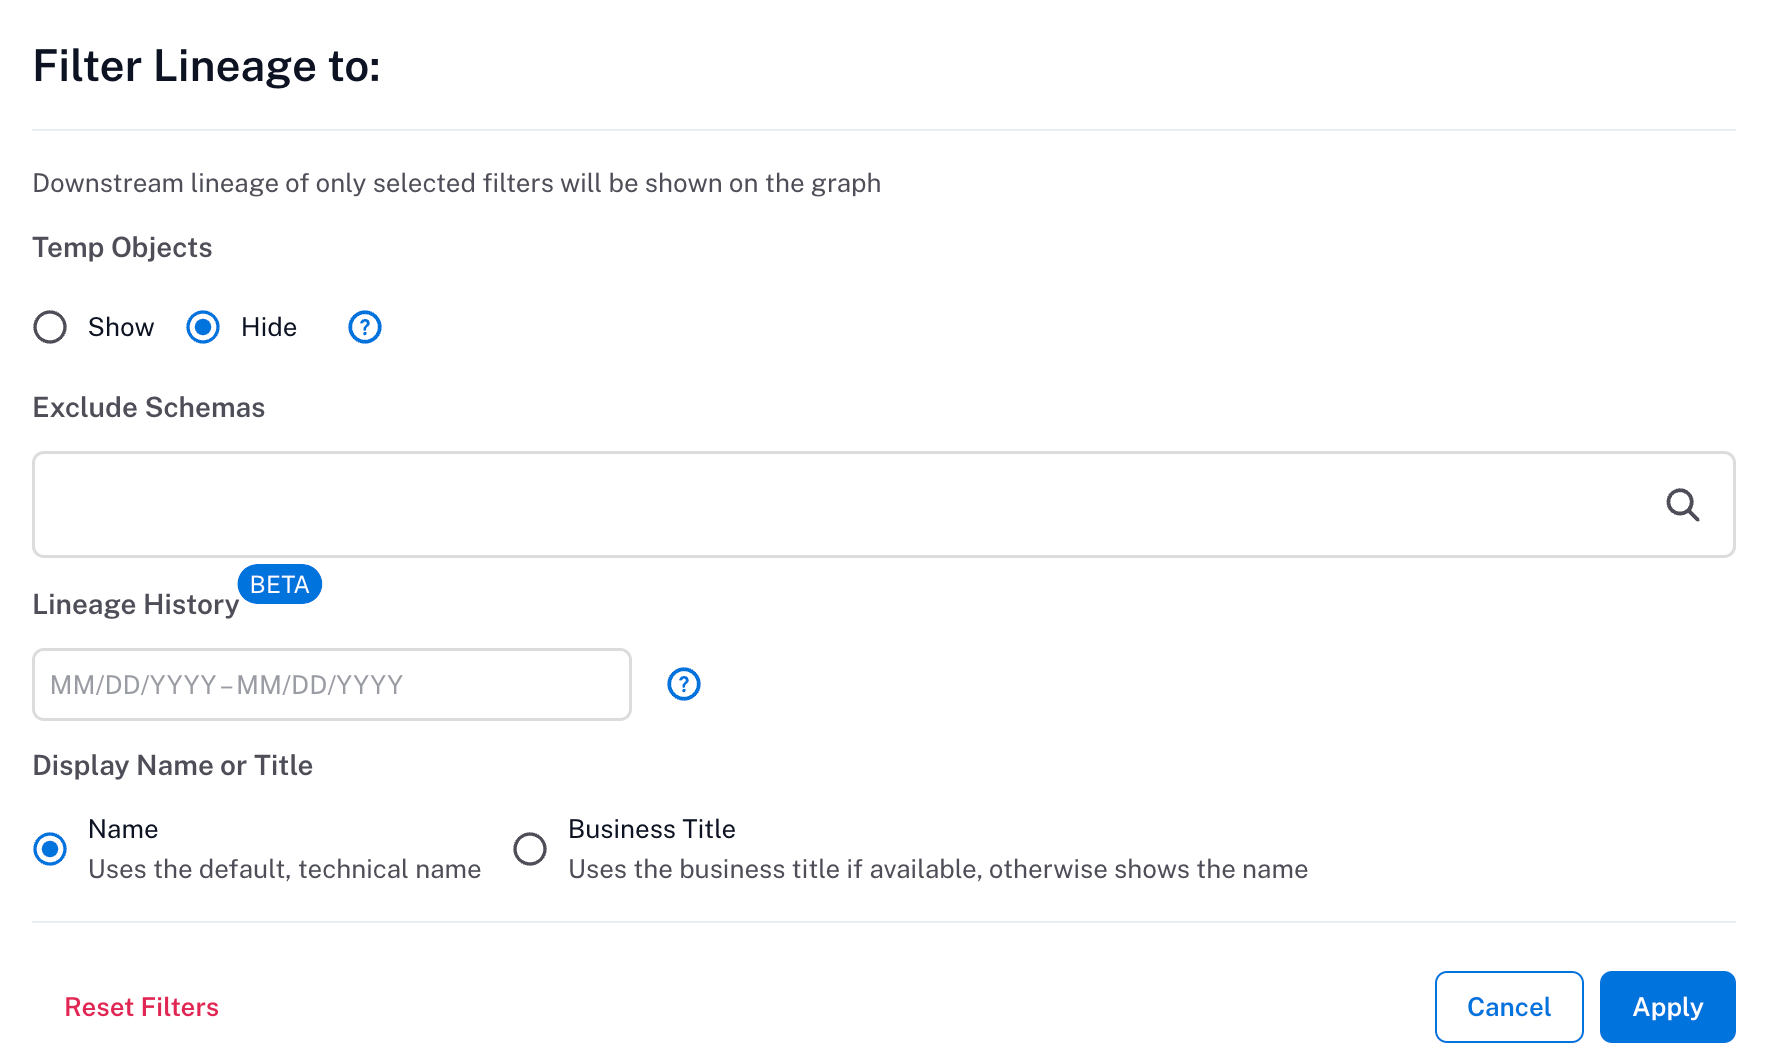
Click the Filters button in the top left corner of the chart to open the Filter Lineage dialog.
Under the Temp Objects filter, select the Show radio button.
Click Apply. The nodes with the TMP badges will be displayed.
To hide temporary objects:
Click the Filters button to open the Filter Lineage dialog.
In the Temp Objects filter, select the Hide radio button.
Click Apply. The temporary nodes will be hidden from the chart.
Apply a Date Range to Lineage Charts (Beta)
Alation Cloud Service on the cloud-native architecture
Available from version 2024.3.5
You can filter lineage information on the lineage chart based on the date range of ingested lineage data. This allows you to display only the lineage within a specific timeframe.
Server Admins can use the Lineage History filter to show or hide dataflows created through query log ingestion (QLI) for a selected date range. By using Lineage History, you can confirm whether a specific batch of lineage data has been successfully ingested.
To use the Lineage History filter:
Navigate to the catalog page and open the Lineage tab.
Click Filters on the top left corner of the chart to open the Filter Lineage dialog.
Click Lineage History (Beta).
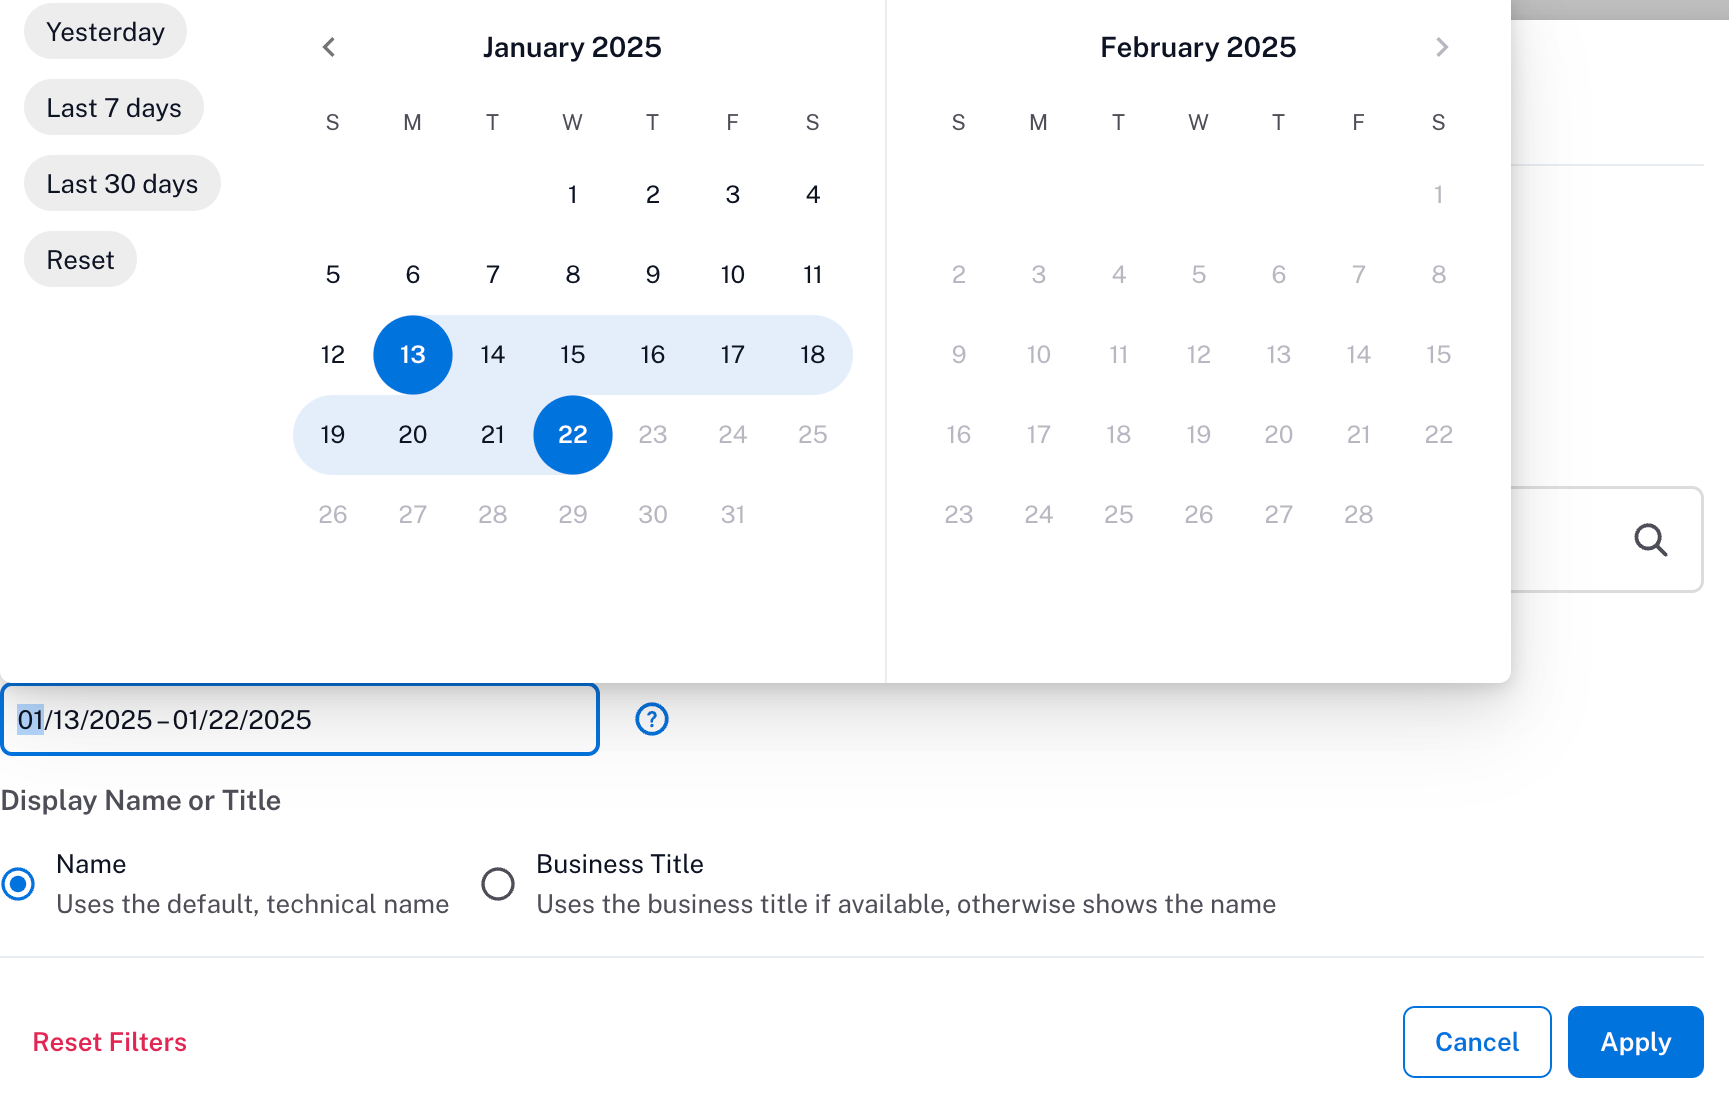
Adjust the range by selecting a predefined date range from the options on the left or by choosing a custom range using the calendar.
Click Apply to apply the filter.
Note
By default, charts display QLI lineage data for the last 30 days. This default range is pre-set in the Lineage History field within the Filters dialog. You can modify the range by selecting different dates or resetting the filter. The default time range is controlled by the feature flag
lineage-service.filters.default_time_rangeinalation_conf. To change this setting, contact Alation Support.
Limitations
Lineage information displayed on lineage charts can come from multiple sources, including QLI, API, manual inputs, and MDE. This filter applies only to the QLI pipeline with the following limitations:
If a chart contains lineage from multiple sources, only QLI-generated lineage is filtered. Lineage from API, manual inputs, and direct lineage (where lineage is extracted directly from the database during metadata extraction (MDE)) remains visible.
The Lineage History filter does not apply to data sources that support direct lineage. For example, Databricks Unity Catalog supports direct lineage and is not affected by this filter.
Display Name or Title
Availabe from version 2024.1.1
You can choose to display either the technical name or the title of an object on the chart:
Title is the value of the Title field on the catalog page of an object. This is an editable name given to the object by users who curate catalog pages, which can also be modified via API.
Technical name is the name of a catalog object that originates in the metadata extracted from the source. Technical names cannot be edited by catalog users.
By default, technical names are used as labels on lineage nodes.
To switch between the name or the title:
Navigate to the catalog page of an object and open the Lineage tab.
Click Use Compound Layout to switch to the compound layout view.
In the top left corner of the chart area, click Filters to open the Filter Lineage dialog.
Under Display Name or Title, choose:
Name to use technical names.
Business Title to use catalog titles.
Click Apply to update the node labels in the lineage chart. If an object doesn’t have a title, its technical name will be displayed.
Note
The label change applies to the current user and only affects the current view of the chart. Navigating away from the object’s catalog page or refreshing the page will revert the display to the default view.
Apply Metadata Layers
A metadata layer is an additional visual overlay on the Compound Layout view that allows for visualizing additional metadata, such as trust flag information, data quality indicators, or values of custom fields. Users apply metadata layers by selecting them from the Metadata Layer list on the chart.
By default, no metadata layers are visible.
You can select and display one metadata layer at a time. You have the following options:
Details on the currently displayed indicators are available in the Metadata Layer Summary.
Trust flags
Applies from version 2024.1
You have the ability to apply the trust flags information to the chart as an additional metadata layer.
To apply the Trust Flags metadata layer:
Locate the Metadata Layer list on the top left of the lineage chart in the compound layout view. By default, no metadata layers are selected.
Click the down arrow to open the list of available metadata layers.
Select a layer to display. You can display one trust flag layer at a time.
Deprecation Flags—Display the deprecation flags. Deprecation is propagated from source objects to target objects and from parent objects to child objects.
Warning Flags—Display the warning flags added directly to the object. This option doesn’t display the warnings that are propagated from deprecation flags on source or parent objects.
All Warning Flags—Display all the warning flags, including propagated warnings.
Endorsement Flags—Display the endorsement flags.
When you select a layer, it is applied to the chart.

To remove a metadata layer from the chart, open the Metadata Layer list and click the Reset link in the top right corner.
Data Quality
The data quality metadata layer shows the data quality values on the Data quality Tab of an object.
To apply the Data Quality metadata layer:
Click the down arrow of the Metadata Layer list to open the list of available metadata layers.
Under Data Quality, select Data Quality.
The data quality indicators will appear near the nodes where they exist for the corresponding object.
There are three types of indicators:
Alert—Red
Warning—Yellow
No quality issues—Green
For example, the screenshot below shows a data quality alert (red indicator).
Data quality propagation on lineage charts uses the same logic as the Data Quality tab.
Data Quality Propagation on Lineage Charts
If there exists a data quality value for an object, it is also propagated to the downstream objects. This applies only if the lineage is present when the data quality values are created. The total data quality count will be the sum of upstream data quality values and the object’s own data quality values. Propagation will happen only between source to target parent nodes (data quality values are not propagated to leaf nodes like RDBMS columns, BI datasource fields, or BI report fields).
Custom Fields (Beta)
Available from version 2024.3.1
The custom fields metadata layers show custom field values that were configured to appear on lineage charts. Custom Field metadata layers are not available unless they have been configured. Users with the Server Admin and Catalog Admin roles perform the configuration: Configure Custom Fields Metadata Layers.
Note
Only the Picker field type can be used as the Custom Field metadata layer.
To apply the custom field metadata layers:
Click the down arrow of the Metadata Layer list to open the list of available metadata layers.
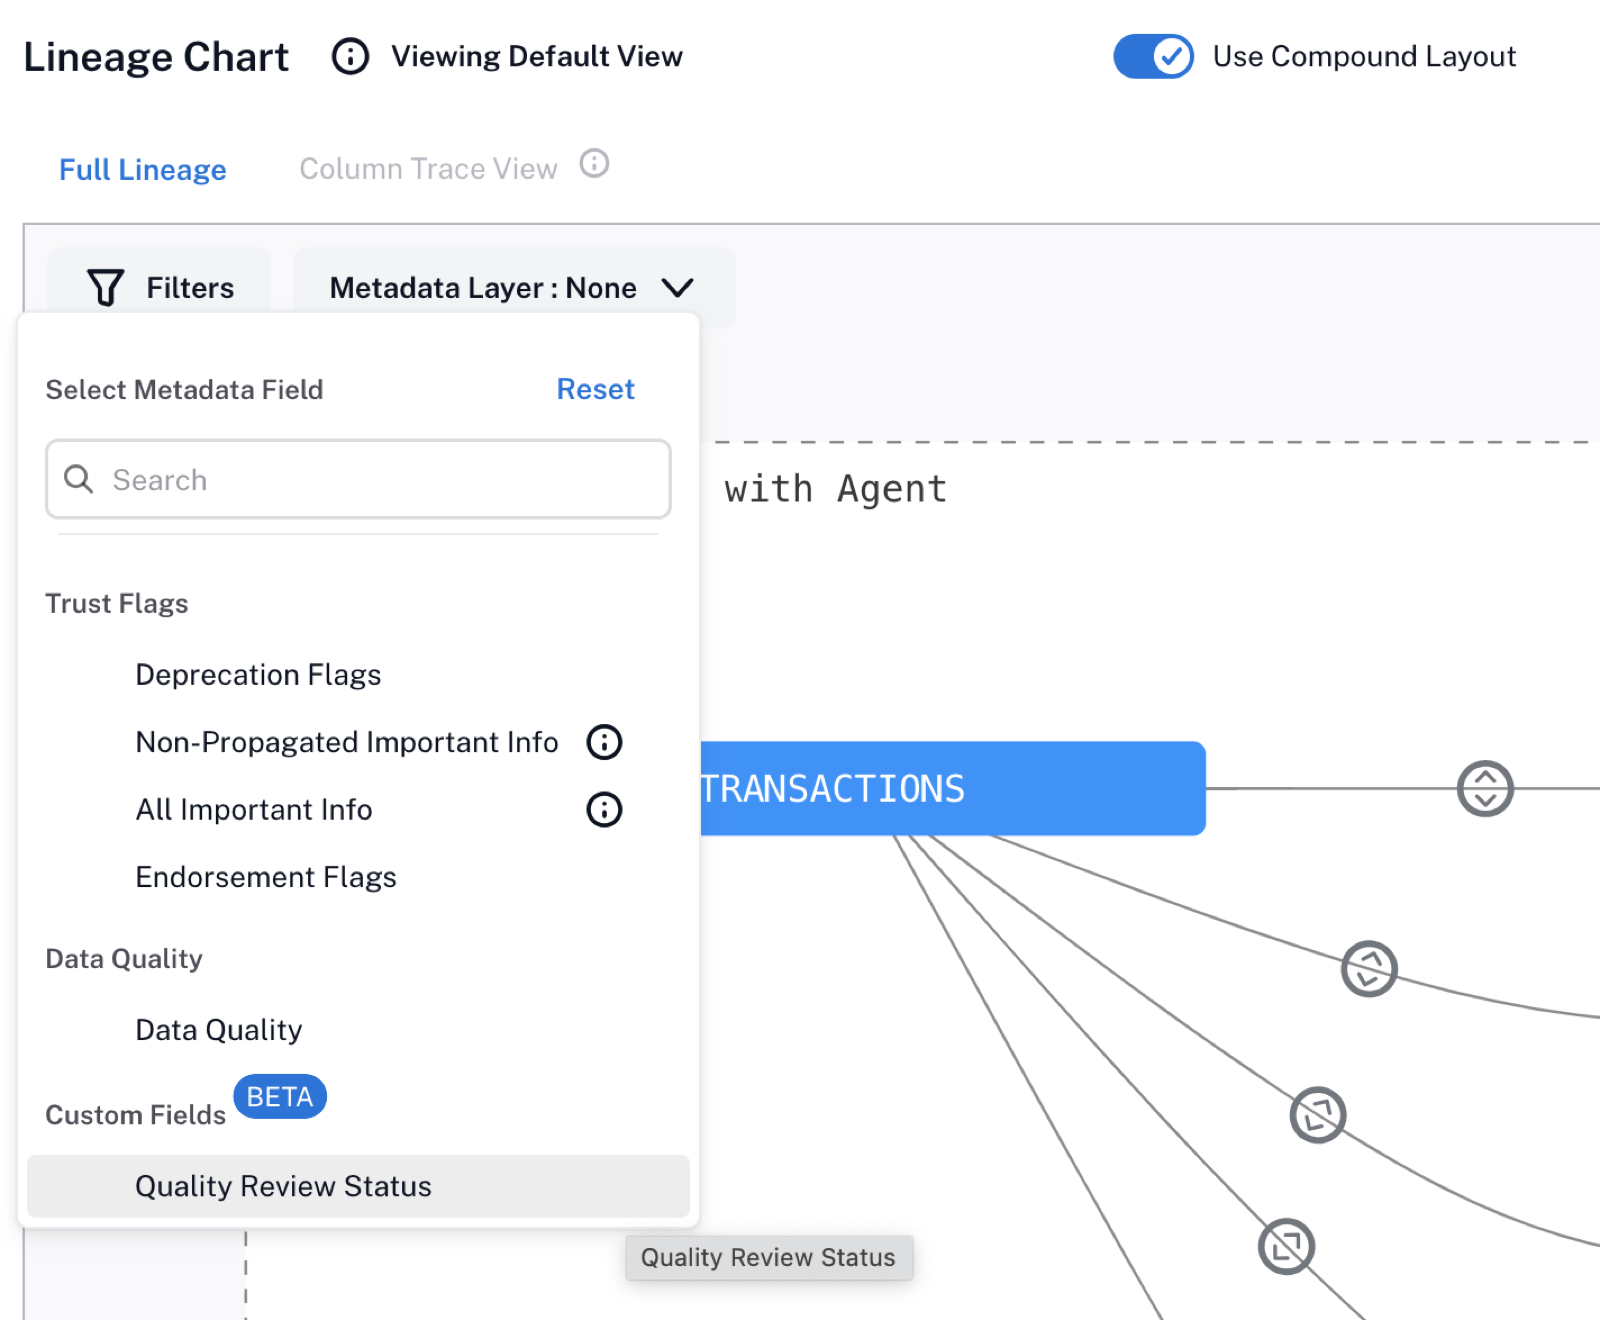
Under Custom Fields, select the field that you want to display. Each field is displayed as a separate layer. You can display one field at a time.
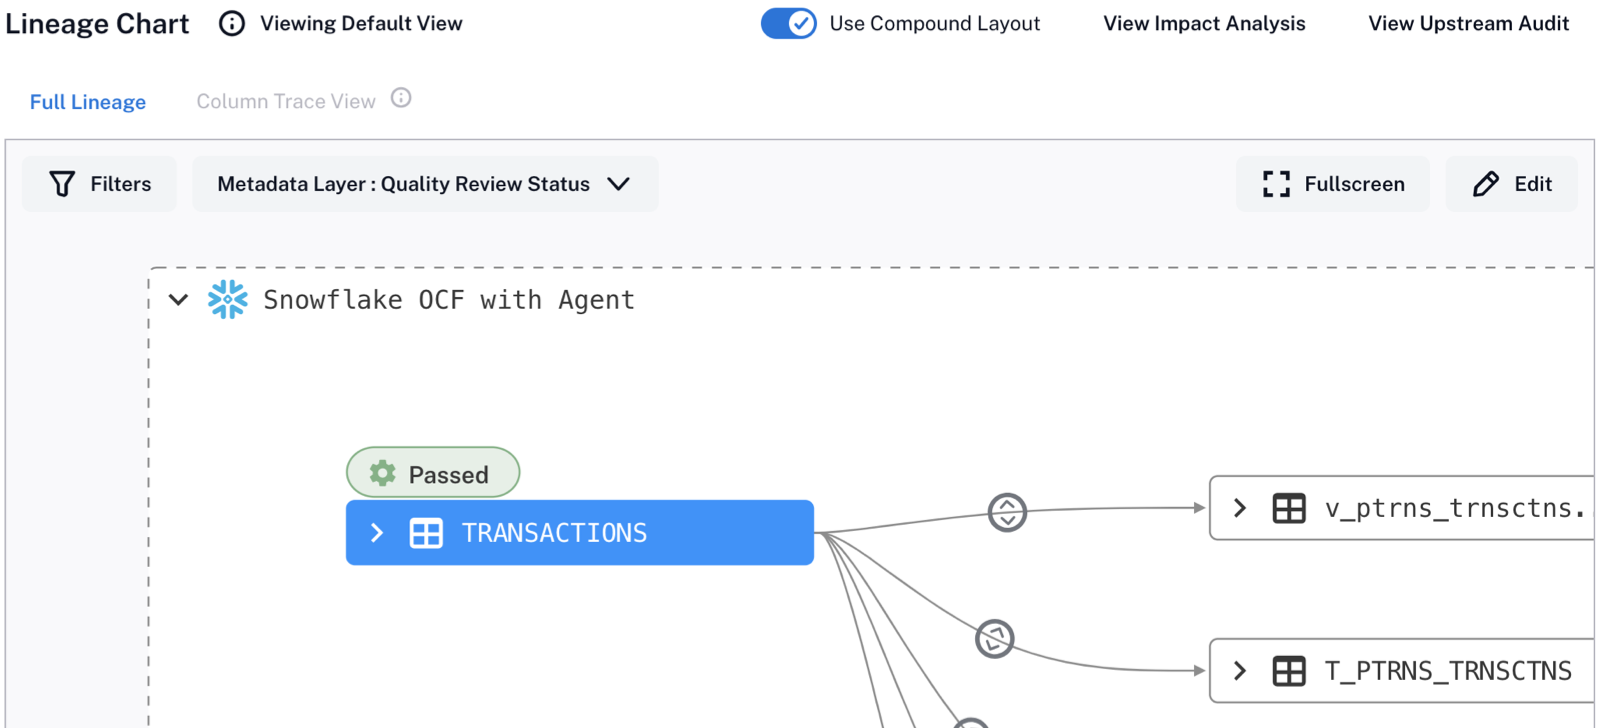
You will see the field value displayed on top of the nodes where the corresponding objects have it.
Note
If the custom field value has been set via a catalog set, it won’t appear on lineage charts.
View Metadata Layer Summary
After you display a metadata layer on the chart, you can view more information about the corresponding indicator in the metadata summary.
To view the summary:
On the compound layout view, click on the metadata layer indicator (a trust flag, a quality indicator, or a custom field value). The summary pop-up will appear, displaying the following information:
Description
Stewards
Upstream and downstream connections
Last updated
Specific metadata layer details
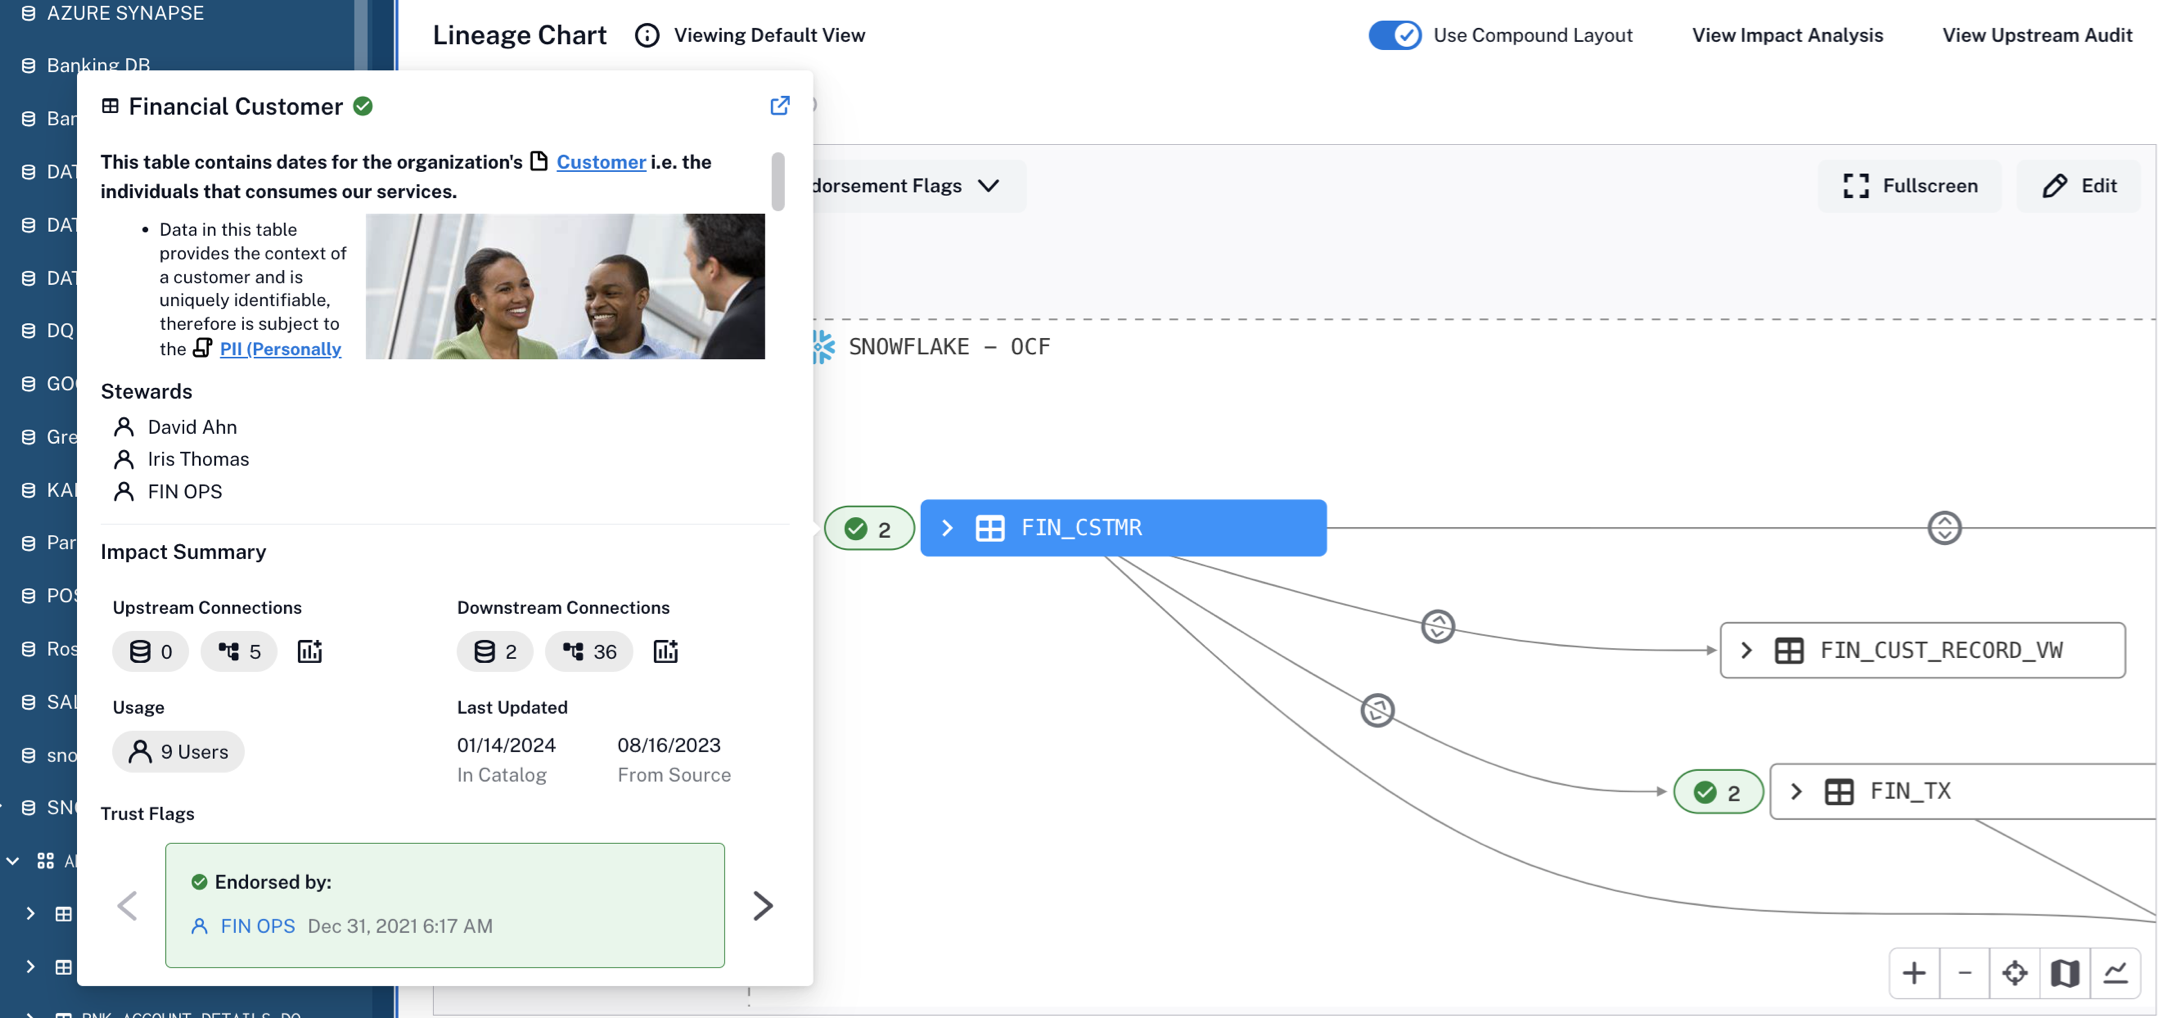
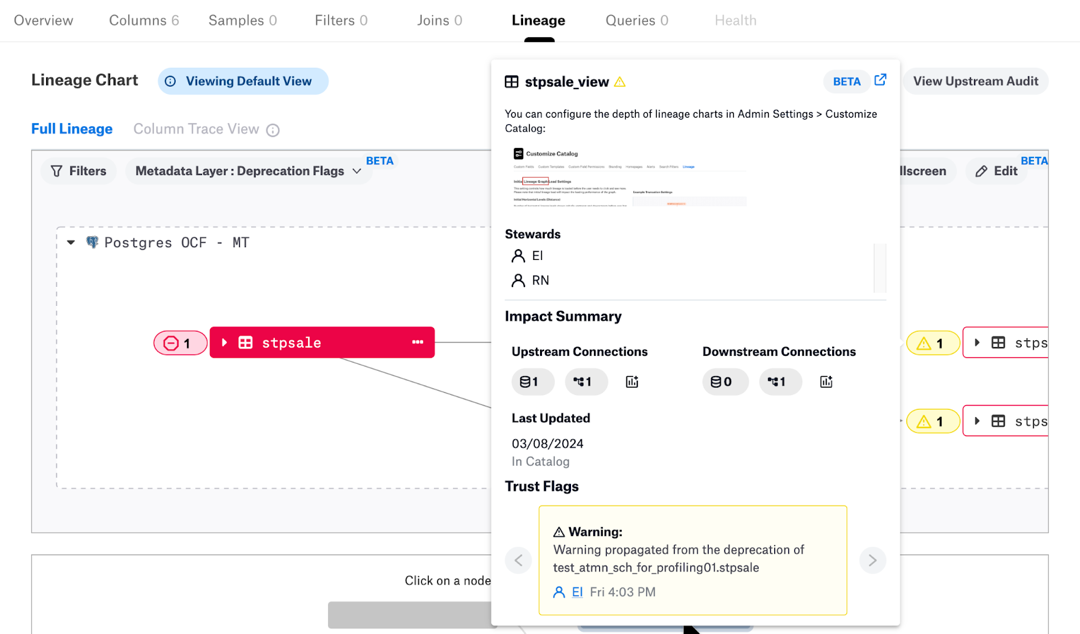
From the Trust Flag layer summary, you can further explore the upstream or downstream impact of the lineage node by viewing the corresponding tabular lineage reports. To view the reports, click the report icon under Upstream Connections or Downstream Connections.

Use Tabular Lineage Reports
Applies from release 2021.1
You can view the downstream or upstream lineage of an object in a tabular format. See Leverage Lineage Impact Analysis.
Exclude Schemas
Available from version 2024.3.2
Lineage charts can become complex, displaying numerous nodes from different schema objects across multiple data sources. When all nodes are shown at once, the graph may be difficult to navigate effectively.
You have the ability to exclude specific schemas from the lineage chart to reduce visual clutter.
To exclude schemas:
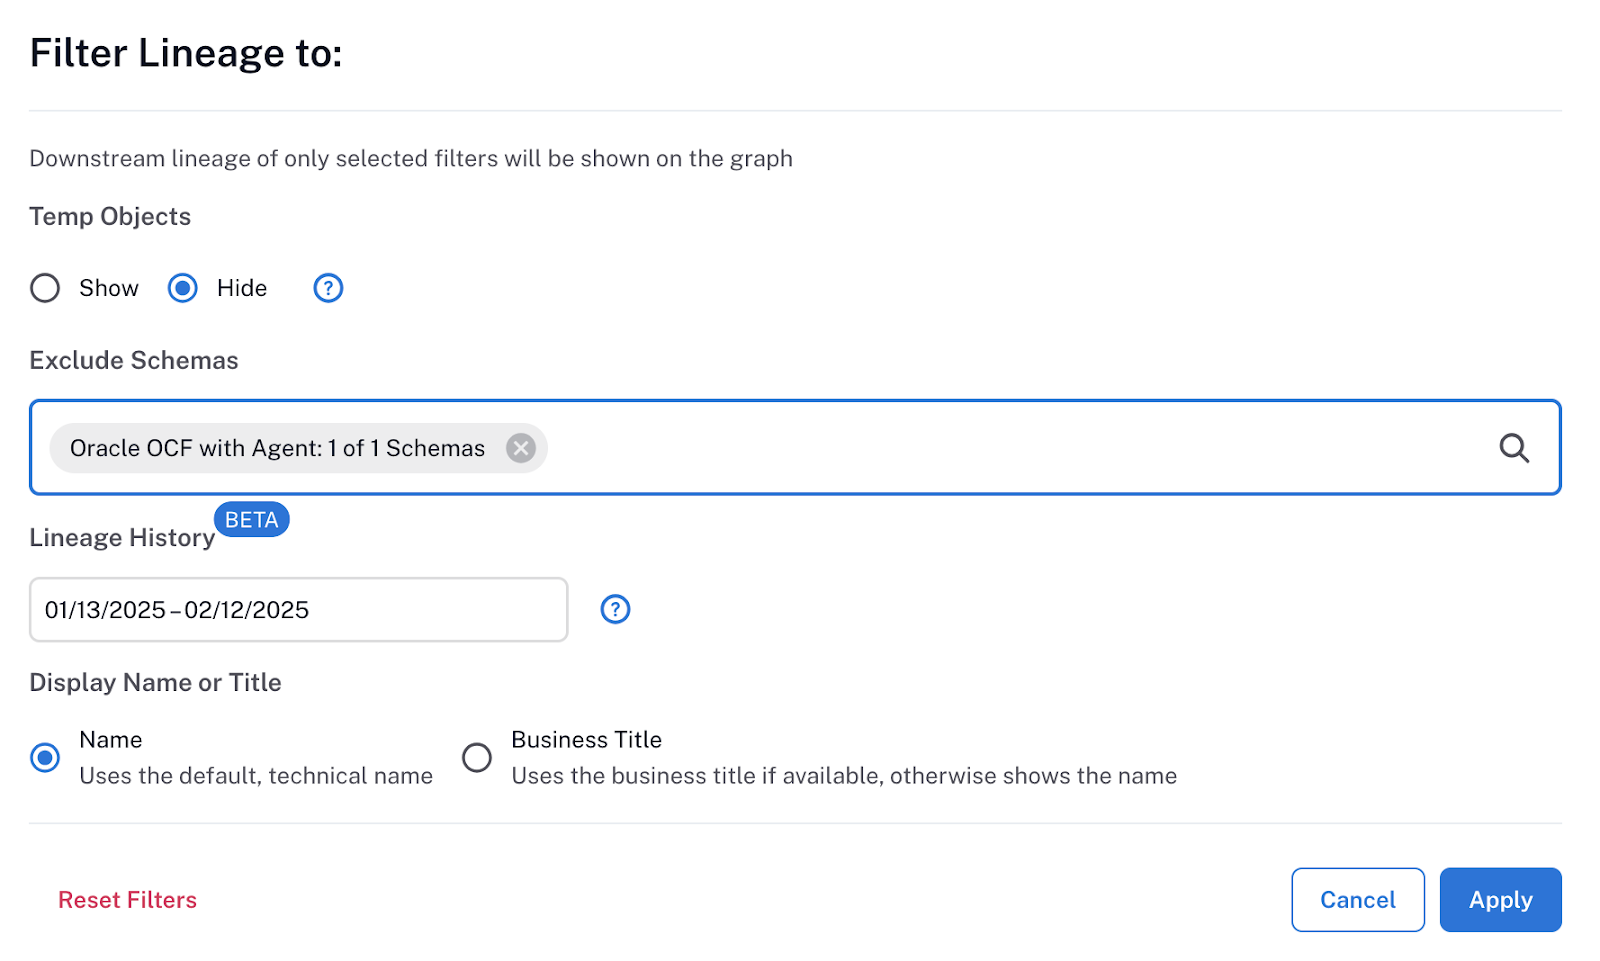
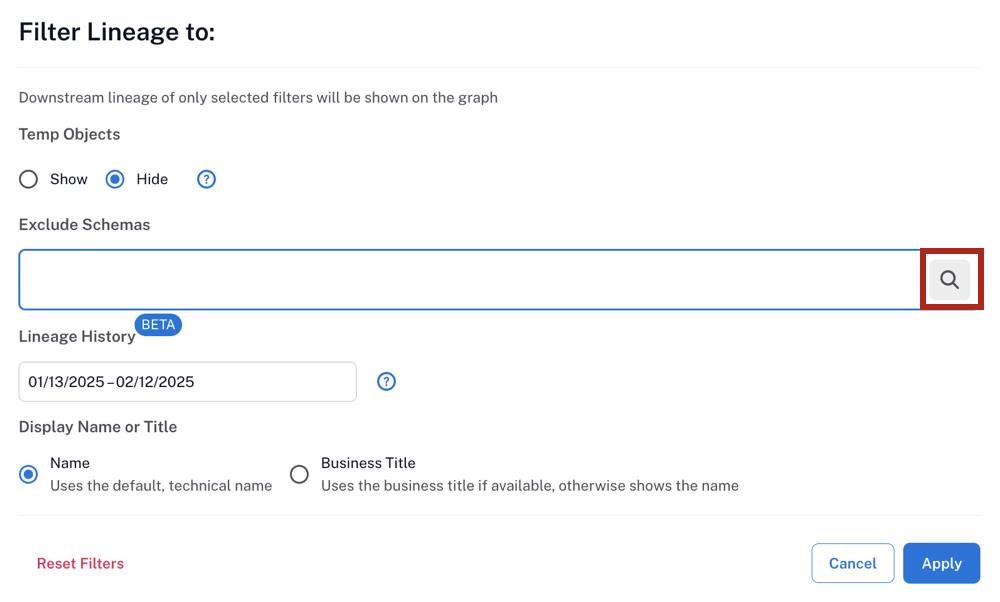
On top left of the chart, click Filters. The Filter lineage to dialog opens.
In this dialog, locate the Exclude Schemas field.
Click the Search icon at the far right of Exclude Schemas.
Important
Make sure to click on the Search icon exactly and not on the field. Clicking on the field won’t work.
The Select Data Sources list opens, displaying the data sources relevant to the current chart (the ones that are parent objects to nodes on the lineage chart). To get to schemas, you’ll be using the data source filter first.
Click on the data source that is parent to the schemas you want to exclude. If the list of data sources is too large, use the Search bar under Select Data Sources to filter the list first.
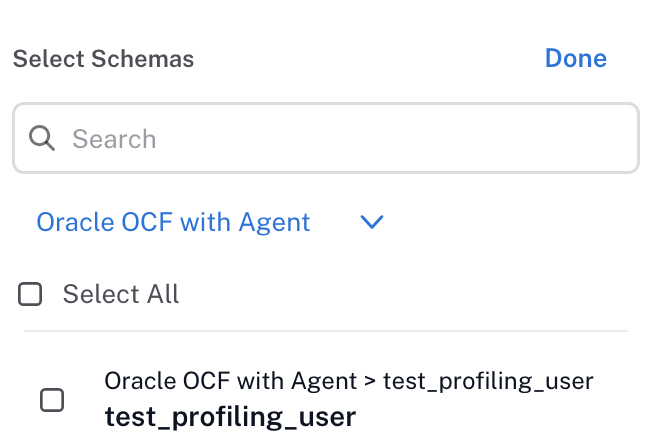
After selecting a data source, a list of relevant schemas will appear. These schemas contain tables and views that are displayed in the lineage chart. Choose schemas to exclude from the lineage chart by selecting the corresponding checkboxes. If you want to exclude all schemas in this data source, select the Select All check box on top of the list. If the list of schemas is too large, use the Search bar under Select Schemas to filter the list.
You can select schemas from different data sources. To select more schemas from a different data source, change the data source in the data source dropdown list and select more schemas.
After selecting all desired schemas, click Done on top right of the Select Schemas widget. The information about selected schemas appears in the Exclude Schemas field, displaying the number of selected schemas per data source.
Click Apply in the Filter lineage to dialog to apply the schema filter to the chart. The lineage nodes from the schemas you excluded will be hidden from the chart.
Reopening the Filter lineage to dialog without refreshing the page or navigating away from the catalog page retains the previously selected filters.
To update your Exclude Schemas filter:
On top left of the lineage chart, click Filters.
To remove all schemas for a data source:
Click the delete icon (X) for schemas in the Exclude Schemas field to deselect all schemas for a data source.
Click Apply in the Filter lineage to dialog to apply the updated schema filter to the chart.
To remove or add specific schemas:
Click the search box under Exclude Schemas to open the list of data sources.
Select a data source. Select or deselect schemas in this data source by selecting the corresponding checkboxes in the Select Schemas widget.
Click Done on top right of the Select Schemas widget to update your selection of schemas.
Click Apply in the Filter lineage to dialog to apply the updated schema filter to the chart.
Global Exclude Schemas Filter
Catalog administrators can also exclude schemas from lineage charts globally in the catalog Admin Settings.
When a schema is excluded globally, it won’t appear on lineage charts by default and will be pre-populated in the Exclude Schemas filter. The filter value persists even after refreshing the browser.
If you open the Exclude Schemas filter and see a value you didn’t add, it was likely set by an admin as a global filter. You can manually remove it, but the schema will be added back if you navigate away or refresh the page.
Schema Filter and Schema Access Permissions (Beta)
Alation Cloud Service on the cloud-native architecture
Applies from Backend version 2024.3.5
Starting in version 2024.3.5, your Data Source Admins can set up specific access permissions on schemas. The permissions can be quite restrictive: certain objects can only be accessible by specific users and inaccessible by most users. This feature is beta and disabled by default. It requires server configuration to be enabled. Find more information in Data Source Privacy Settings.
Currently, restricted permissions on schemas don’t have an impact on your ability to exclude schemas from lineage charts.


