Monitor Data Anomalies
Alation Cloud Service Applies to Alation Cloud Service instances of Alation
Anomaly detection in Alation Data Quality uses machine learning to establish baseline trends and identify unusual deviations in your data.
Anomaly detection metrics enable automated identification of unusual patterns and deviations in your data. By establishing baseline trends through machine learning, Alation Data Quality can alert you to unexpected changes that may indicate data quality issues, system problems, or significant business events.
The anomaly detection follows a lifecycle:
Assign Anomaly Metric: When you create a monitor, you can assign anomaly metrics to a table or column for analyzing data patterns.
Warmup Period: When an anomaly metric is assigned, it enters a 30-day warmup period. During this time, the model analyzes historical patterns to learn your data’s normal behavior, seasonality, and expected variation. No alerts are generated during this phase.
Baseline Establishment: After the warmup, the model has an established baseline. It continues to run at its scheduled interval, comparing the latest metric value against the learned baseline to detect true anomalies.
Feedback Loop: The model’s accuracy improves over time through user feedback. When you review anomalies, you can use the actions Confirm Anomaly or Mark as Expected. This feedback teaches the model to recognize legitimate business events (like planned data loads) and reduce false positives.
Anomaly Metrics
Table-Level Anomaly Metrics
Metric Type |
Description |
|---|---|
Row Count |
Detects unusual changes in the number of rows in a dataset. This metric helps identify unexpected data volume fluctuations that may indicate missing data loads, duplicate ingestion, or data deletion issues. |
Freshness |
Detects unusual delays in data updates based on timestamp columns. Use this metric to monitor whether data is being refreshed according to expected schedules and identify pipeline delays or failures. |
Schema Drift |
Detects unexpected changes to table structure, including added, removed, or modified columns. Schema drift detection helps prevent downstream application failures and ensures data contracts remain intact. Schema drift detects the following changes:
|
Column-Level Anomaly Metrics
Metric Type |
Description |
|---|---|
Duplicate Count |
Detects unusual changes in the number of duplicate values in a column. This metric identifies potential data quality degradation when columns expected to contain unique values show increasing duplication. |
Missing Count |
Detects unusual changes in the number of null or missing values in a column. Monitor completeness trends to catch upstream data quality issues before they impact downstream consumers. |
Maximum |
Detects unusual changes in the highest value within a numeric column. Useful for identifying outliers, data entry errors, or legitimate business events that push values beyond typical ranges. |
Minimum |
Detects unusual changes in the lowest value within a numeric column. Helps catch data errors, such as negative values in columns that should only contain positive numbers, or unexpected zero values. |
Average |
Detects unusual changes in the average value of a numeric column. This metric reveals shifts in central tendency that may indicate changing business conditions or data quality issues. |
Standard Deviation |
Detects unusual changes in data spread or variability within a numeric column. Increasing or decreasing variability can signal changes in data collection processes or underlying business dynamics. |
Add Anomaly Metrics
When you create a monitor and apply checks, you can add anomaly metrics. This is an optional feature during monitor creation. For more information, see Add a Monitor.
Manage Anomalies
You can add or remove more tables and anomaly metrics for a configured monitor. This is done when you already created a monitor and want to manage the previously added anomaly metrics. For more information, see Manage a Monitor.
Note
Anomaly detection is only available for manual monitors. The Anomaly Metrics section is not displayed in the Manage tab for SDK monitors.
Navigate to the Alation Data Quality application and from the left-pane menu click the Monitors tab.
Click on a monitor name to view its details.
Navigate to the Manage tab and locate the Anomaly Metrics section.
For existing tables, add one or more table-level anomaly metrics.
For existing columns, add one or more column-level anomaly metrics.
To remove a previously added anomaly, expand the row and click Delete.
Note
You cannot edit a previously added anomaly. You can only add or delete it.
Analyze Anomalies
When you run the monitor and anomalies are detected, after a warmup period of 30 days, anomaly metrics start to appear in the Monitors > Monitor Name > Anomaly Metrics tab.
The detected anomalies are represented in the following ways:
Time-Series Graphs: Most metrics are displayed as time-series visualizations showing the metric value over time with anomaly indicators highlighting unusual data points.
Heat Map: Schema drift anomalies are displayed using a heat map visualization that highlights structural changes in table schemas over time.
Anomaly Metric Statuses
Anomaly metrics display one of the following status indicators:
Anomaly: Red indicator. The model detected an unusual deviation.
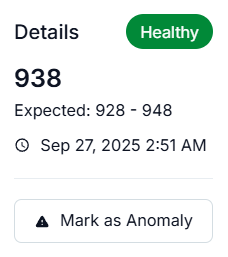
Healthy: Green indicator. Data is within the expected baseline.
Training: Blue indicator. The metric is in its initial 30-day training phase while the model learns your data’s normal behavior. Training metrics do not display a trend sparkline. When you expand a training row, the chart is hidden but the Run Details table remains visible.
Errored: Purple indicator. A query execution error occurred. Errored metrics display error markers on the chart, and hovering over them shows error details in the tooltip. Click on an error marker to view the full error details in a modal.
No Data: Grey circle-slash icon. The metric is configured but no data is available. Rows with this status show N/A for the value, have an empty trend column, and cannot be expanded.
Use the filter chips at the top of the Anomaly Metrics tab to filter by status. The Training filter shows only metrics still in their training phase. The No Data filter shows only metrics without available data. Metrics with a Training or No Data status are excluded from the Anomaly and Healthy filters.
Table Grouping
Metrics are grouped by table. Each table section shows the data source, schema, and table name with a count badge indicating the number of metrics configured for that table. Click a table section to expand it and view the individual metrics. This grouping helps you locate metrics for specific tables when a monitor includes multiple tables.
To analyze anomalies:
Navigate to the Alation Data Quality application and from the left-pane menu, click the Monitors tab.
Click on a monitor name to view its details.
Open Anomaly Metrics that provides an overview of the detected anomalies at the table and column-level.
View the time-series graph or a heat map for detected anomalies.
For table-level metrics, click on metrics to view details.
For column-level metrics, click View Details.
View the anomaly representations marked in red and hover over the detected anomalies or healthy ones for further details and actions.
Provide feedback to the large language model (LLM) to improve anomaly detection accuracy over time in the following ways:
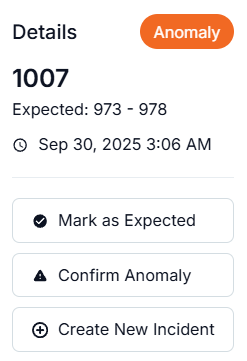
When you hover over a data point, you see an anomaly card pop up where you can access feedback actions:
If the detected anomaly is as expected, click Mark as Expected.
To confirm the detected anomaly, click Confirm Anomaly.
To link the detected anomaly to an incident management system, click Create New Incident or Link to Existing Incident (if you already have one).
To mark a healthy pattern as anomaly, click Mark as Anomaly.